Screen Any Texas Site
in 5 Minutes, Not 5 Weeks
Terrain analysis, infrastructure proximity, pad placement, and cut/fill estimates — all from publicly available elevation data. No survey crew required for early screening.
The Old Way Is Burning Time and Budget
Data center developers evaluate dozens of sites before breaking ground. Each manual screening takes weeks and thousands in survey costs — just to rule out bad terrain.
Weeks of Wait
Traditional surveys need scheduling, mobilization, and processing. By the time you get results, the land may already be under contract.
$10K+ Per Site
Hiring a survey crew for topographic data, then a civil engineer to interpret it. Multiply by every site you're evaluating.
Gut-Feel Decisions
Without quantitative terrain data, teams rely on Google Earth eyeballing. Slope issues, flood zones, and drainage problems get caught late.
Everything You Need to Screen a Site
Draw a boundary on the map. Get a full terrain intelligence report with actionable data.
Slope, Elevation & Drainage — Instantly
- •USGS 1-meter LiDAR elevation data across your entire AOI
- •Slope classification: flat (<2%), gentle (2-5%), moderate (5-15%), steep (>15%)
- •Depression detection to identify natural drainage and ponding risk
- •Cut/fill volume estimates for pad grading

How Far Is Power, Transmission & Highway Access?
- •Electric substations within 10 miles — with voltage and distance
- •Transmission line corridors mapped with proximity stats
- •Interstate and US route access — critical for heavy equipment delivery
- •All data from HIFLD (Homeland Infrastructure Foundation-Level Data)

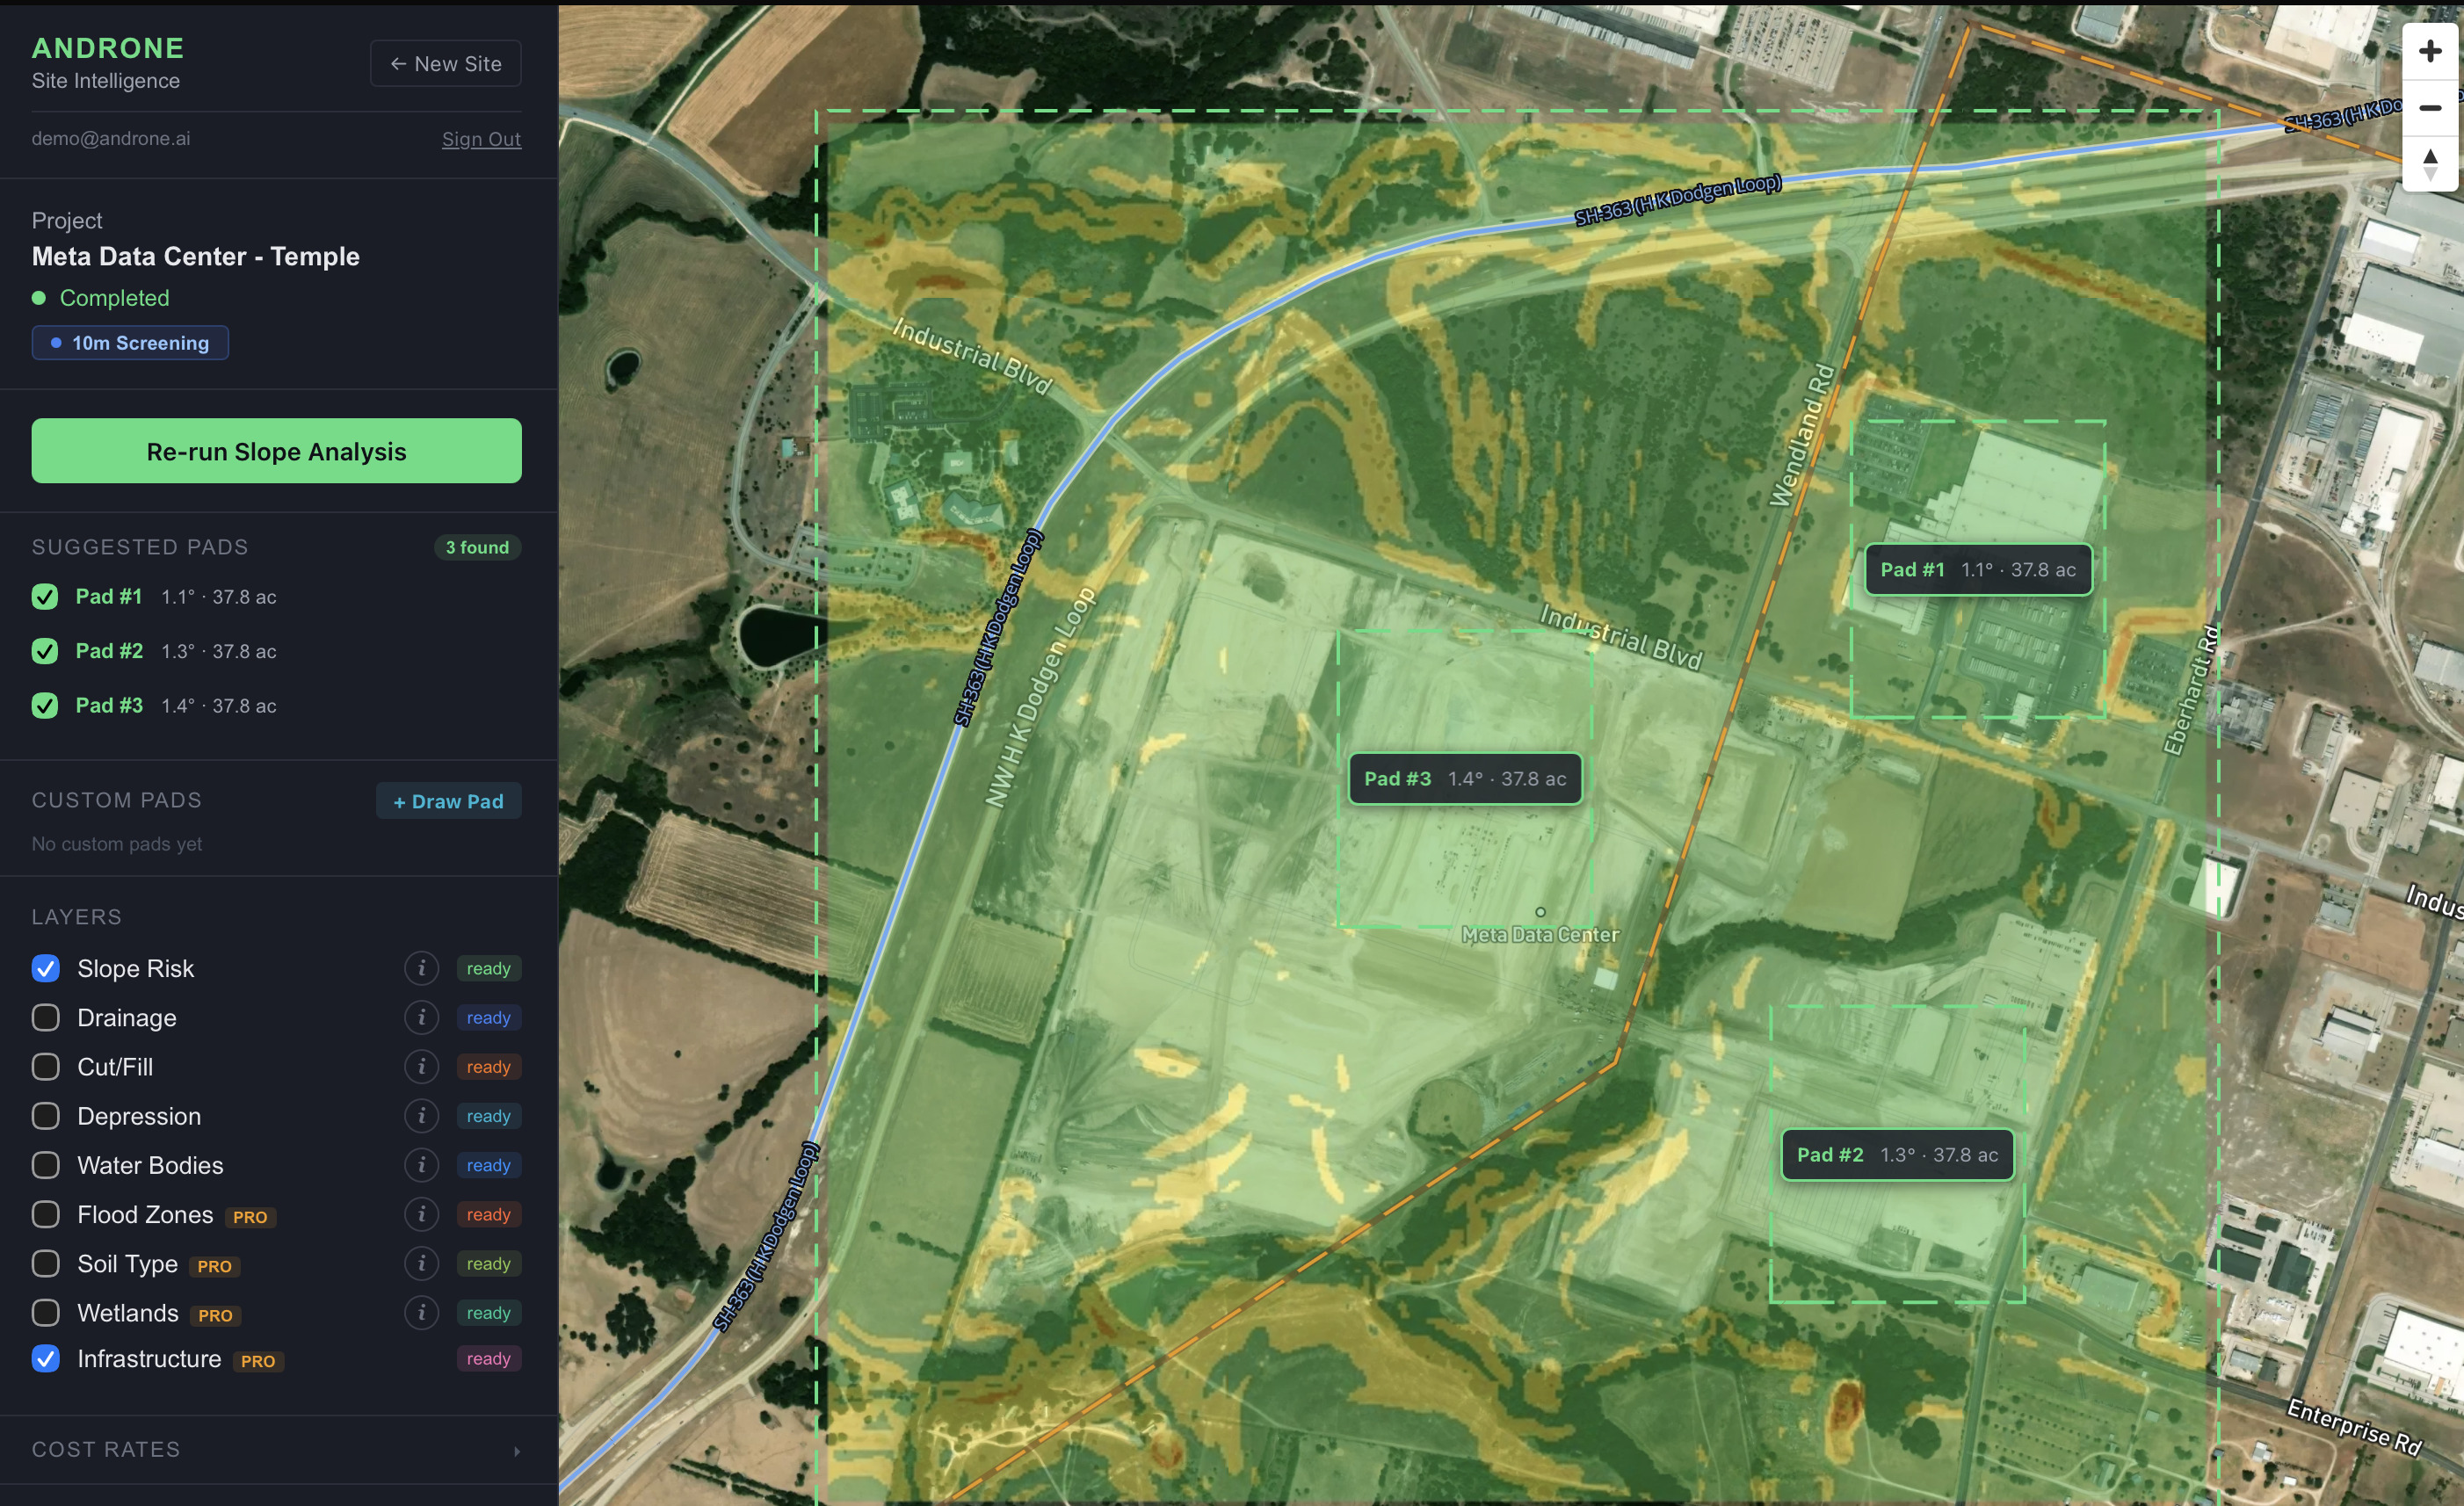
Optimized Construction Pad Candidates
- •Algorithm finds the flattest, most buildable areas within your boundary
- •Considers slope, flood risk, wetland avoidance, and buffer zones
- •Cut/fill volume estimates for each candidate pad
- •Add custom pad locations to compare against algorithmic suggestions

Compare 2-3 Sites Side by Side
- •Weighted composite scoring across terrain, flood, wetland, and infrastructure
- •Per-metric best-site highlighting
- •Normalized scoring so different-sized parcels are fairly compared
- •Export-ready for stakeholder presentations

From Map Click to Intelligence Report
Three steps. Five minutes. Zero field visits.
Draw Your Boundary
Drop a polygon on the map over any site in Texas. Doesn't need to follow parcel lines — just outline the area you care about.
We Run the Analysis
Our pipeline pulls 1m LiDAR elevation data, queries FEMA flood zones, NWI wetlands, and HIFLD infrastructure layers. Terrain is classified, pads are optimized, and a full report is generated.
Review & Compare
Explore interactive map layers, review the site intelligence brief, download the PDF report, or compare multiple sites side-by-side with weighted scoring.
A Report Your Stakeholders Will Actually Read
Auto-generated site feasibility report with terrain statistics, flood zone status, infrastructure distances, and pad placement analysis. Drop it into any LOI or board deck.
- ✓Executive summary with key site metrics
- ✓Slope distribution and cut/fill estimates
- ✓FEMA flood zone and wetland assessment
- ✓Infrastructure proximity stats
- ✓Pad candidate ranking with scores

Purpose-Built for Data Center Site Selection
Texas is the #1 data center market in the US. Hyperscalers and colocation providers are evaluating hundreds of parcels. Androne lets your land team screen sites before committing engineering dollars.
Stop Guessing. Start Screening.
Analyze your first site in under 5 minutes. No credit card, no field visit, no waiting on a survey crew.